In detail
Current portfolio case study
Client: Sonora Fly Co., serving Yosemite, Sonora Pass, and the Sierra Nevada
Role: Full-stack design engineer
Stack: Next.js 14, React, TypeScript, Tailwind CSS, Radix UI, Leaflet, Recharts, Notion API, MongoDB/Mongoose, Inngest, OpenWeather, USGS, CDEC, Dreamflows, Square Catalog API, GoDaddy blog feeds, Vercel Speed Insights.
Problem and approach
Anglers needed local reports, river flows, water-temperature context, weather, access points, tactics, and equipment guidance scattered across editorial, environmental, and commerce systems. Staff needed publishing without code changes; environmental readings needed automatic refreshes and useful mobile presentation.
I designed and built the information architecture, responsive interface, integrations, and operational workflows around trip-planning decisions: where to go, conditions, access, and equipment.
Implementation
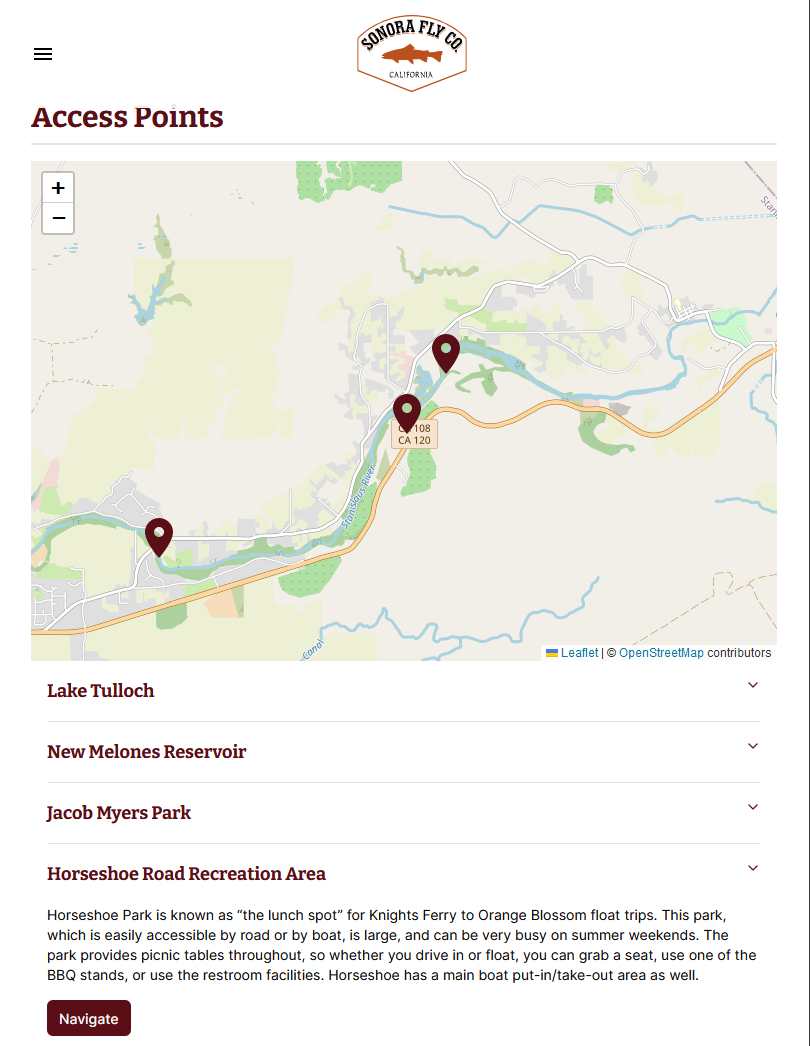
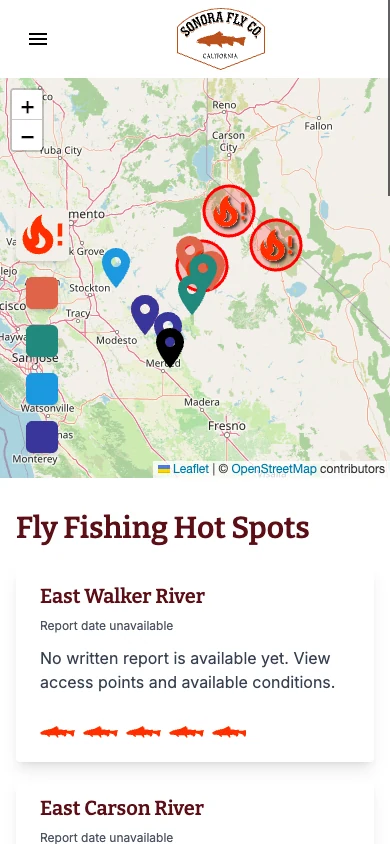
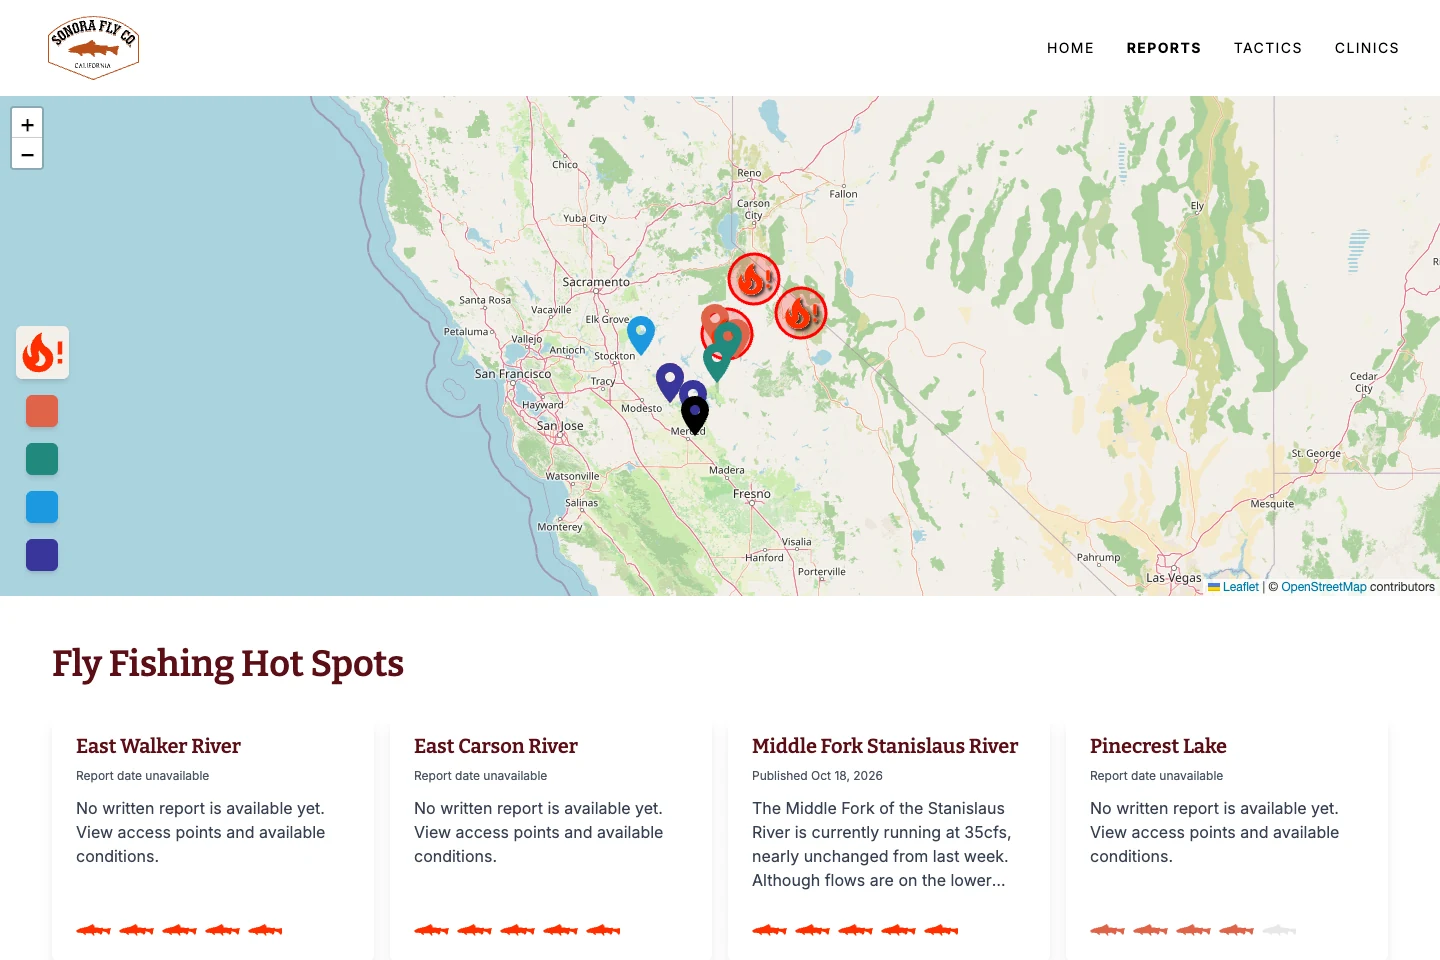
- Leaflet/OpenStreetMap discovery plots published reports with rating markers and hottest-location alerts. Destination maps include access descriptions and Google Maps navigation.
- Reports combine tactics, guides, flies, gear, current conditions, historical flows, applicable releases, forecasts, and access points. Tabs, accordions, and expandable sections manage density.
- Notion stores ratings, coordinates, slugs, blog categories, access/measurement points, provider IDs, release stations, and product SKU relationships. Related records and report blocks resolve into the published experience.
- Source-selection/fallback logic combines USGS, CDEC, and Dreamflows for current/historical flow, temperature, reservoir outflow, and applicable release schedules. Processing filters invalid sentinels and normalizes dates/units, using California time for state-data windows.
- Inngest reads active Dreamflows stations from Notion, parses CSV readings, upserts MongoDB river identities, and avoids duplicate timestamps. A second schedule removes readings older than one week.
- OpenWeather provides forecasts and conditions; GoDaddy categories supply editorial context; Notion SKUs resolve Square names, images, prices, and shopping links.
- Server components, source-specific cache revalidation, lazy loading, localized Suspense, optimized images, loading states, and Speed Insights support the multi-source app.
Outcomes and limitations
Delivered unified local expertise, conditions, navigation, shopping, staff publishing, and responsive field-use patterns. Environmental sources can be delayed or unavailable; conditional sections, null-safe rendering, fallbacks, and independent loading boundaries prevent one missing feed from removing the whole report. No quantified business/performance results were reported.
Adapted from portfolio text. Existing narrative, screenshots, and implementation archive remain below.
The problem
Planning a day on the water meant connecting fishing reports, weather, river conditions, and access information from different sources. Sonora Fly Co. needed a clearer way for anglers to see that information together.
My role
I helped the Sonora Fly Co. team design and build a responsive reports experience, combining interface design and implementation with the team's local fishing knowledge.
Design decisions
Start with location
An interactive map and location list give anglers a way into the information through the place they want to fish. Hot spots and individual reports then bring more specific detail into view.
Keep useful context together
Weather forecasts, historical flow data, fishing reports, and access points sit within the reporting experience rather than requiring visitors to assemble them across unrelated sites.
Connect publishing and data
The original implementation below connected blog publishing, report ingestion, environmental APIs, and contextual product information. These systems are part of making the interface useful, not just implementation details behind it.
Delivered
- An interactive map and location-oriented reporting experience.
- Individual reports with weather, flow history, and mapped access points.
- Publishing and data integrations supporting the report content.
- Contextual product information through Square integration.
These are delivered capabilities, not a claim of measured engagement or sales improvement.
Implementation archive
The following screenshots and notes document the original implementation. They are preserved as historical evidence and may differ from the current live product.
Check it out!
Interactive Map with all fishing locations
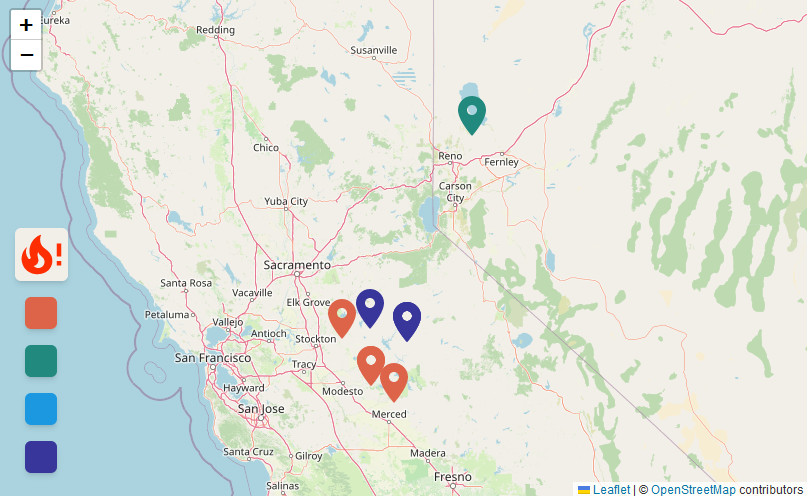
Top Fishing Hot Spots
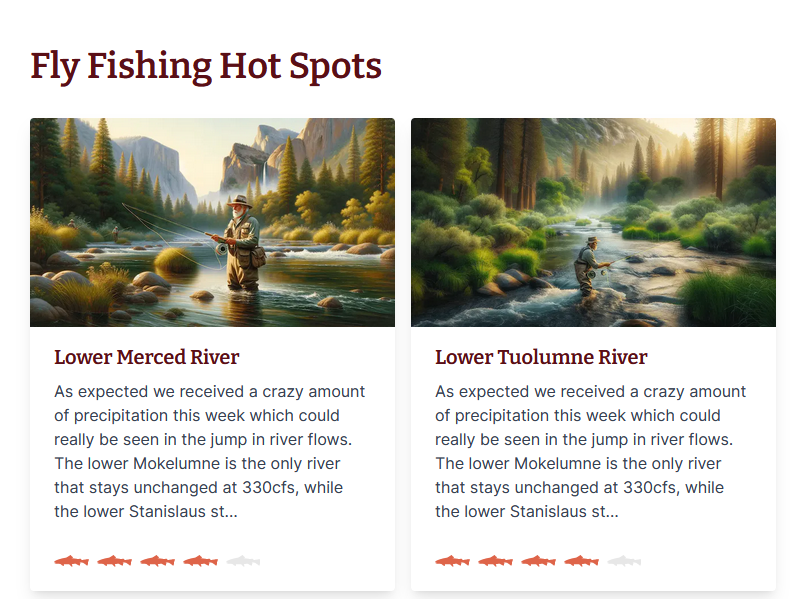
List of all fishing locations
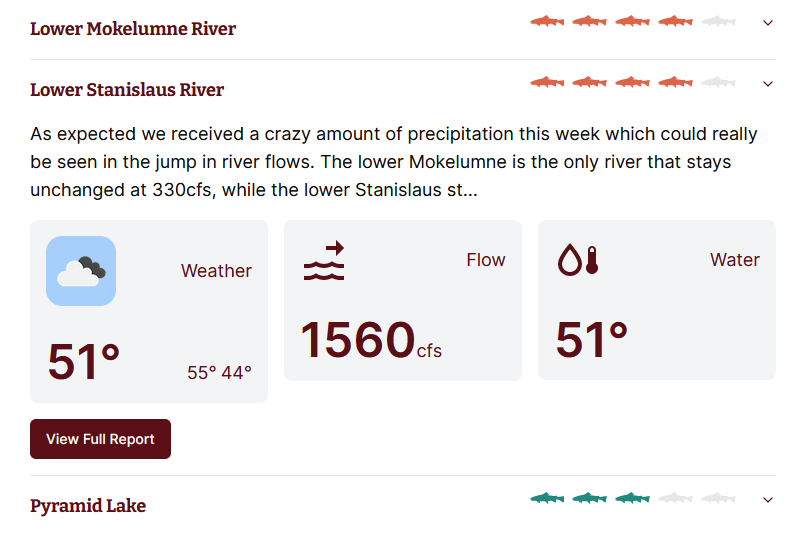
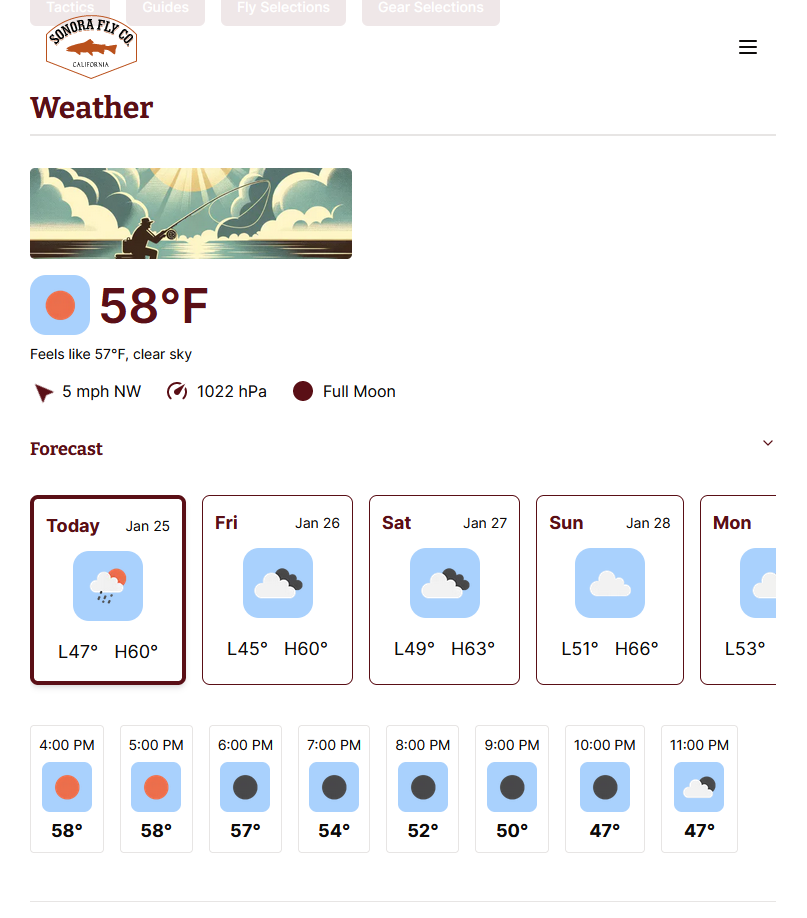
- Weather provided by Open Weather Map API
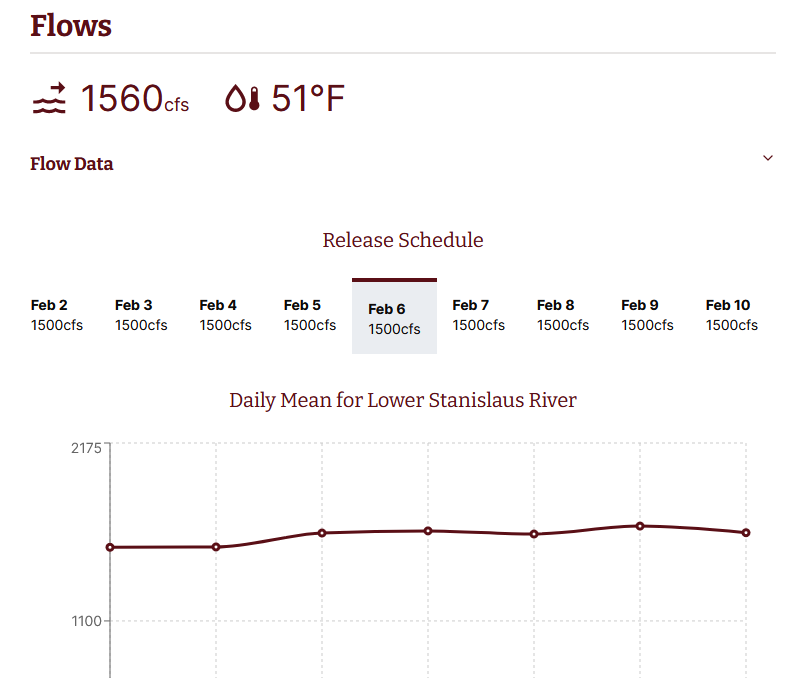
- Flow data provided by either United States Geological Survey API or California Data Exchange Center API
Full Report View
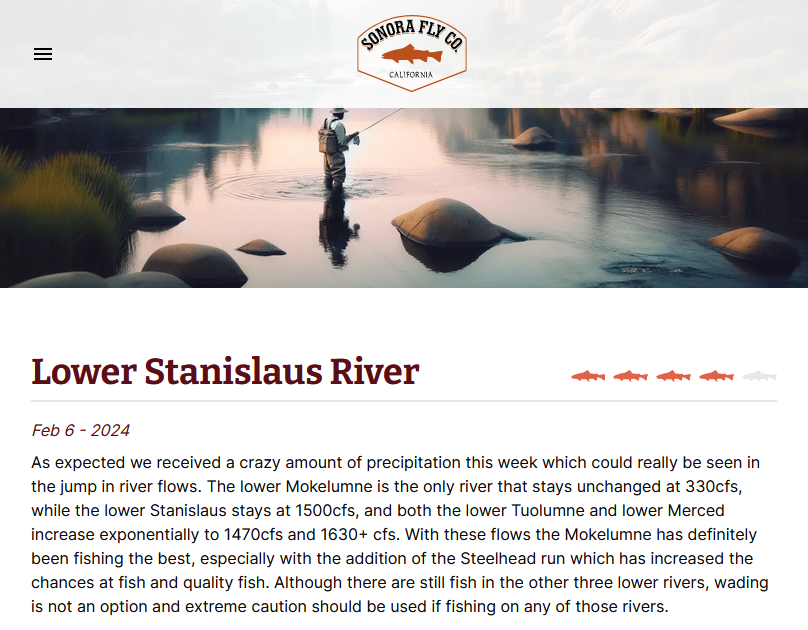
- The fishing report get’s posted to the Sonora Fly main blog. This kicks off an automation on Pipedream to scrape the content of the post and converts it to markdown where it is stored in a database and rendered here.
- Chat-GPT API is used to help convert the post into markdown
- RSS Feed endpoint is used to get all the fishing reports for each location from the main Sonora Fly blog.
- Initial hero images generated with Dall-E
Additional Integrations
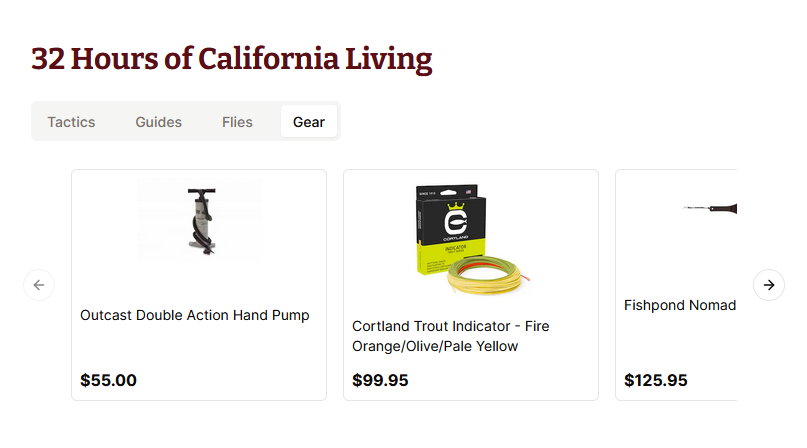
- Square API integration to get list of catalog items
Current Weather and Forecast
Historical Flow Data
Access points with map